The Flow: Pohrer Monthly Market Update - September, 2021
Clients, perspective clients, buyers, sellers, real estate enthusiast, colleagues and friends,
This month, I’m trying something new. Over the last 12-24 months the headlines splashed across national and local media have been highlighting the VERY HOT Palm Beach real estate market (see chart below).
It’s very interesting times in Palm Beach real estate and I’d like to share both my analytical and anecdotal view of the market and what I’m seeing on the ground. On a monthly basis you’ll be receiving a memo similar to the one below where I will share with you my perspective on the market, what we’re seeing on the ground and also what we’re seeing in the data.
I hope you find it valuable and an insightful monthly read.
If your inbox is already overflowing (I get it) and you’d like to opt out feel free to unsubscribe below or shoot me a note to be removed.
Best Regards,
Gary
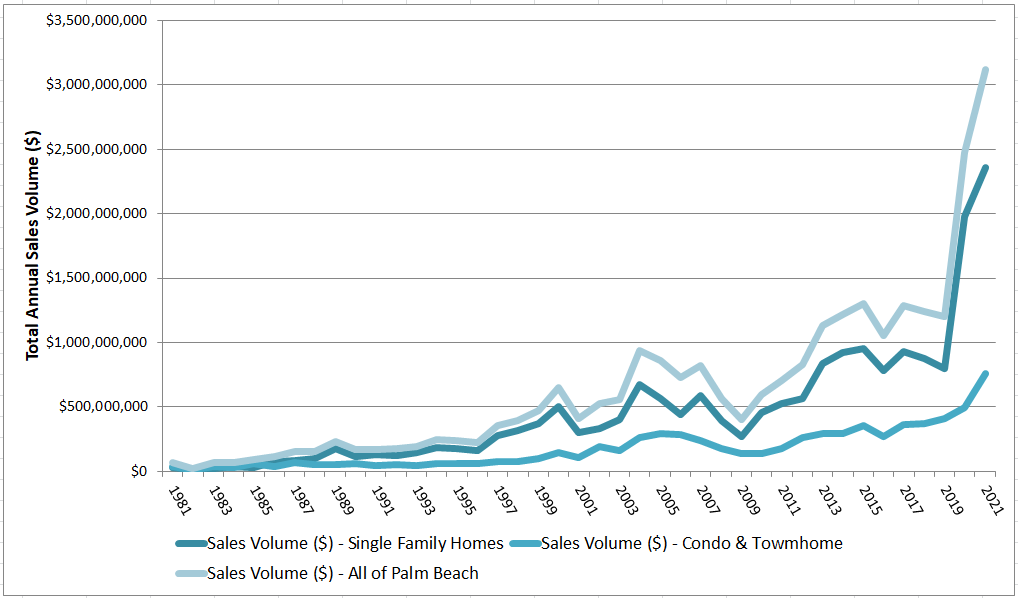
Real estate sales on Palm Beach Island are well above last year levels with four more months left in the year. As of August 2021 we have surpassed $3B in real estate transactions.
Market: Palm Beach Island
Asset Class: Single Family Homes, Condo & Townhomes
Executive Summary:
We had another busy summer. Overall transaction volume ($) for single family homes is up 110% YoY from $108.6M in August 2020 to $228.3M in August 2021. It’s up 376% from August 2019 to August 2021. This continues to be driven by large price appreciation in the Palm Beach market and the continued increase in demand post pandemic.
Price appreciation on the single family home asset class for the year just hit 52.9% when you compare 2020 to 2021. We have not seen this level of 1 year price appreciation in the Palm Beach market since the year 2000 where appreciation from 1999 to 2000 hit 43%. We’re also seeing price appreciation for the condo & townhome market coming in at ~10%, not quite as high as single family homes.
Single family home inventory continues to remain at all time low levels for the last three months (~34 homes on market). This is down 69% YoY.
Single family home days on market continue to be driven down further due to low inventory levels. August hit a record low for average days on the market of 102. That is down 69% YoY and down 37% compared to the previous month of July.
Observations on the ground:
Since inventory is so tight, we are having to ask our existing property owner clients if they would consider selling. Most are asking where would I go? The others that consider selling are backing out when reality sets in that they have to move.
People are starting to take a step back due to pricing unless it is move-in ready.
Rentals are nearly impossible as hotels and rentals are basically all sold out. Surprisingly, this is causing some clients to consider renting their homes for a big price for a month or two.
What we're seeing in the data.
Palm Beach Island - Single Family Homes
Single Family Homes Summary: Transaction Volume (# of sales)
Summer transaction volume continues to be up significantly compared to pre-covid summer levels of 2019.
August transaction volume increased 36% from July but is down 12% YoY from last August.
Waterfront transaction volume decreased from 4 to 3 homes sold from July to August but is up from 0 to 3 homes sold compared to last year August sales.
Non-Waterfront transaction volume is up 71% from July to August and is down 29% YoY.
All Homes on Palm Beach: Transaction Volume (#)

Single Family Homes Summary: Sales Volume ($)
Sales volume ($) in August is up 110% YoY and is up 376% from August 2019 to August 2021.
Sales volume is flat to down slightly (3%) from July 2021 to August 2021.
Waterfront transactions for August makeup 37% of the sales volume, whereas non-waterfront transactions represent 63% of the total sales volume for August.

*2021 represents sales volume through August of 2021.

Price ($) / Square Foot - Palm Beach Single Family Homes (by month)
We’re continuing to see PPSF hold strong as inventory is low and demand remains strong.
PPSF ($) is up August YoY from $1,318 to $3,148 (139%).
Looking at this metric monthly can be bumpy due to 1 or 2 record breaking sales skewing the numbers, so it’s important to look at the annual rate which currently sits at 52.9% YoY PPSF appreciation.
Non-waterfront PPSF ($) has been inching up steadily all year.


Single Family Homes Active Listings (#)
Inventory continues to remain at all time low levels for the last three months (~34 homes on market). This is down 69% YoY.

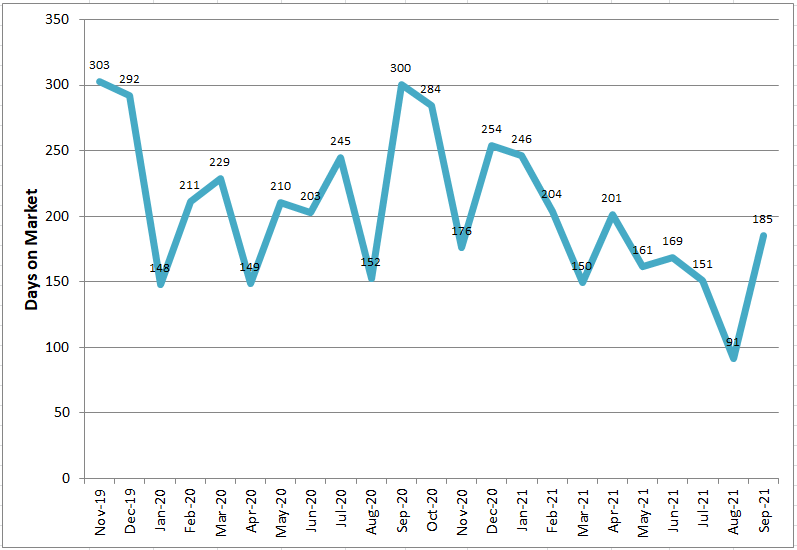
Single Family Homes Days on Market (#)
Days on market continue to be driven down further due to low inventory levels. August hit a record low for average days on the market of 102. That is down 69% YoY and down 37% compared to the previous month of July.

August Single Family Home Sales

Palm Beach Island - Condo & Townhomes
Condo & Townhomes Summary: Transaction Volume (# of sales)
Transaction Volume (#) is up 72% YoY for the month of August (43 in 2021 compared to 25 in 2020). The increase is largely driven by South End transactions which made up 31 of the 43 closed deals during the month of August.
In 2021 the number of transactions has been steadily declining, coming off the April high, whereas last year the volume remained consistent and fairly flat month by month (bouncing around from 15-25 sales per month). This year the monthly volume ranges from 23-99 sales per month.


Condo & Townhomes Summary: Sales Volume ($)
Total sales volume is up 105% YoY (50M in 2021, 24M in 2020) for the month of August.
August Sales volume is split pretty evenly between in-town transactions ($27M) compared to south end transactions ($23M).


Condo & Townhomes Summary: Price Per Square Foot ($)
August was a record level of PPSF for the condo & townhome asset class for 2021. It hit $826 PPSF. This spike was largely driven by a record sale in 2 Breakers Row which sold for $4,550 PPSF.
Again, looking at this metric for the entire year of 2021 it sits right around $737 PPSF which is up 10% compared to 2020.
We’re not seeing as high of a CAGR for the condo & townhouse asset class as we’re seeing in the single family asset class (10%+ annual growth rate compared to 50%+ YoY annual growth rate for single family homes)

Condo & Townhomes Summary: Active Listings (#)
Inventory is down 74% YoY and has been hovering around ~65-70 active listings for the last few months.

Condo & Townhomes Summary: Days on Market (#)
Days on market are a bit more bumpy for the condo & townhouse market. We have not seen the same steady decline in days on the market for condo and townhomes. In general condos and townhomes will sit on market and not move as quickly as the single family homes.
Days on market is down 38% YoY.
August Condo & Townhome Sales

The data represented in this monthly report is a roll up of a subset of the Palm Beach market and is intended to provide an overview of transaction activity for single family homes and condo’s and townhomes on Palm Beach Island. We recognize that there are nuances by location and based on specific property features even within Palm Beach Island. If you are interested in receiving a more detailed analysis on the value of your property or a property you’re considering please contact us below with your request and we can provide a more detailed comparable analysis report. We look forward to hearing from you.
Data Source: All data presented in this report is from PAPA, Palm Beach County Property Appraiser public database and/or The Beaches MLS.